
Group of Death Index
Group of Death Index
Ranked by each group's combined WC 2010–2022 performance: wins, goals, and tournament depth.







★ = First-ever World Cup appearance
First-Timers & Underdogs
12 teams making their World Cup debut in 2026.
⭐ World Cup Debutants





🌱 Low Experience (≤5 prior matches)




Every World Cup draw creates its own map of pressure, possibility and reputation. This page examines the groups that carry the greatest competitive weight, covering the men’s World Cup groups from 1998 onwards and the twelve groups set out for the 2026 tournament. The archive includes historical sections such as Brazil 2014 Group B, Korea/Japan 2002 Group F, Germany 2006 Group E, Russia 2018 Group D and Qatar 2022 Group C. It also sets out the groups for 2026, with France, Germany, USA and Australia in Group Z, and Spain, Croatia, Senegal and Iran drawn together in Group Y.
Four inputs contribute to the team score: FIFA Ranking accounts for 30%, recent form for 25%, squad depth for 25% and historical tournament performance for 20%. Recent form uses the last five competitive matches, with the latest match carrying the most weight. Squad depth is estimated from prior-season minutes and average market value, while the historical measure gives greater emphasis to the most recent of a team’s last three senior World Cup appearances.
Those four team scores are averaged to create a group score, then compared with the rest of the field. A section qualifies as a group of death only when its average power score exceeds 1.18, at least three teams have pre-tournament win expectancy above 35%, and no more than one team falls below 15%. Since 1998, only nine men’s World Cup groups have met those conditions.
Spain, Croatia, Senegal and Iran make up the projected Group X, a section shaped by contrasting football traditions and three established knockout-stage credentials. Spain bring midfield depth, Croatia carry substantial experience of deep World Cup runs, and Senegal are defined by athleticism. Iran, the AFC side in the group, have matured since 2022 and are described as tactically disciplined. The balance is delicate: each side has a clear route to influence the section, while the combination of Spanish technical quality, Croatian resilience and Senegal’s physical strength gives the group unusual variety.
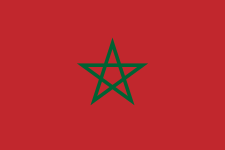
Group Y brings together Brazil, the Netherlands, Morocco and South Korea. Brazil are former finalists, as are the Netherlands, while Morocco arrived at the 2022 tournament as the reigning semi-finalist. South Korea have become a familiar name in the later stages after reaching the top eight. The source material identifies all four as having reached the knockout stage at either of the last two men’s World Cups, leaving little separation in terms of tournament pedigree and making the section among the most competitive.
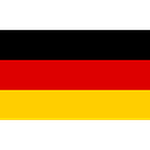
France contribute a prominent forward line, Germany a midfield built around control and structure, the USA have the familiarity of home conditions, and Australia bring experience of tournament football. Together, they form the highest average power score projected by the index since its records began.
Earlier groups offer a historical counterpoint. Brazil 2014 Group B contained reigning champions Spain, the Netherlands, Chile and Australia. Korea/Japan 2002 Group F featured Argentina, England, Sweden and Nigeria, with three sides holding quarter-final-or-better records and Nigeria having reached the Round of 16 in 1998. The role each team played became clear on the field: the Netherlands finished first, Chile second, and England departed after three matches, while Sweden edged Argentina on goal difference.
The Group Power Index is built from four measurable inputs rather than opinion alone. FIFA rankings account for 30 per cent, with a modest adjustment for teams that have played more qualifiers and fewer friendlies in the preceding twelve months. Recent form carries 25 per cent and is drawn from the last five competitive matches, with the most recent weighted most heavily. The form component is refreshed within fifteen minutes of each full-time whistle.
Squad depth contributes another 25 per cent. It is estimated using minutes played by members of the squad during the season before the tournament, then combined with the squad’s average market value. The remaining 20 per cent comes from a dampened examination of each team’s previous three senior World Cup appearances, with greater emphasis on the most recent. Host nations receive a small uplift, currently calibrated at about 12 per cent against the historical performance of hosts.
The team scores are then averaged to create a single group figure, and each group is placed in context with the rest of the draw. The methodology is documented in full, allowing the calculation to be reproduced independently rather than taken on trust.
Those figures describe strength at a particular moment, not destiny. Form changes, squads evolve, and the index has been wrong about group-of-death status in roughly one case in three. Its value lies in showing relative weight and explaining why a section appears difficult, while leaving outcomes firmly in the hands of the teams on the pitch.
The defining threshold is an average power score above 1.18, where 1.0 represents the average World Cup group. At least three teams must also carry a pre-tournament win expectancy above 35%, while no more than one team can sit below 15%. These conditions explain why only nine men’s World Cup groups since 1998 meet the strict definition of a group of death.
The historical examples show how such numbers translate into performances. Brazil’s 2014 Group B contained Spain, the reigning world champions, and the Netherlands, the 2010 finalists, with Chile providing further strength. Spain lost 5–1 to the Netherlands, beat Australia and then were eliminated by Chile. The Netherlands topped the group, with Chile second.
Korea and Japan’s 2002 Group F was decided by fine margins. Sweden topped the table on goal difference, while Argentina finished second on the same measure after beating Nigeria 1–0 in the final round. England were eliminated after three matches. Other groups meeting the definition included Germany’s 2006 Group E, featuring Italy, the Czech Republic, Ghana and the United States; Russia’s 2018 Group D, containing Argentina, Croatia, Iceland and Nigeria; and Qatar’s 2022 Group C, made up of Argentina, Mexico, Poland and Saudi Arabia. For 2026, three sections above that threshold are identified.
Group X pairs Spain, Croatia, Senegal and Iran; Group Y contains Brazil, the Netherlands, Morocco and South Korea; Group Z brings together France, Germany, the United States and Australia. With 48 teams across 12 groups, this edition has the largest draw in the tournament’s history. The numbers establish the strength of each section, but they cannot remove football’s capacity for a different result.
The page will remain useful throughout the 2026 qualifying cycle and beyond the December 2025 draw. As each qualifier is completed, the moving form window will place greater weight on recent competitive results, while squad availability and tournament pedigree continue to shape the individual team scores. Once the groups are finalised, the twelve sections can be assessed side by side rather than through reputation alone.
Several questions will accompany that first update. Will the host United States convert home conditions into a stronger group score? How will Iran and South Korea be measured after their latest tournaments? Can Australia’s experience offset the European strength around them? More broadly, the draw will show whether the projected balance in Groups X, Y and Z survives contact with the final list of teams.
The fixtures themselves will add another layer. Opening matches will reveal how each side structures possession, which midfielders control tempo and whether the attacking players can turn territorial pressure into goals and assists. The subsequent rounds will test squad depth: rotation, injuries and the demands of a congested schedule may alter the balance that existed before a ball was kicked.
The page is refreshed as new information arrives, with the competitive-form component updating within fifteen minutes of every full-time whistle. That makes it a continuing record of the group’s changing composition, not simply a snapshot from the draw. The archive remains available for comparison with groups that were widely described as severe before they produced decisive moments, unexpected eliminations and closely contested league tables.